
Trading Journal Format: What Fields Should You Track? (2026)
The definitive trading journal format breakdown. Discover which quantitative metrics, risk parameters, and psychological tags you must log to isolate your statistical edge.
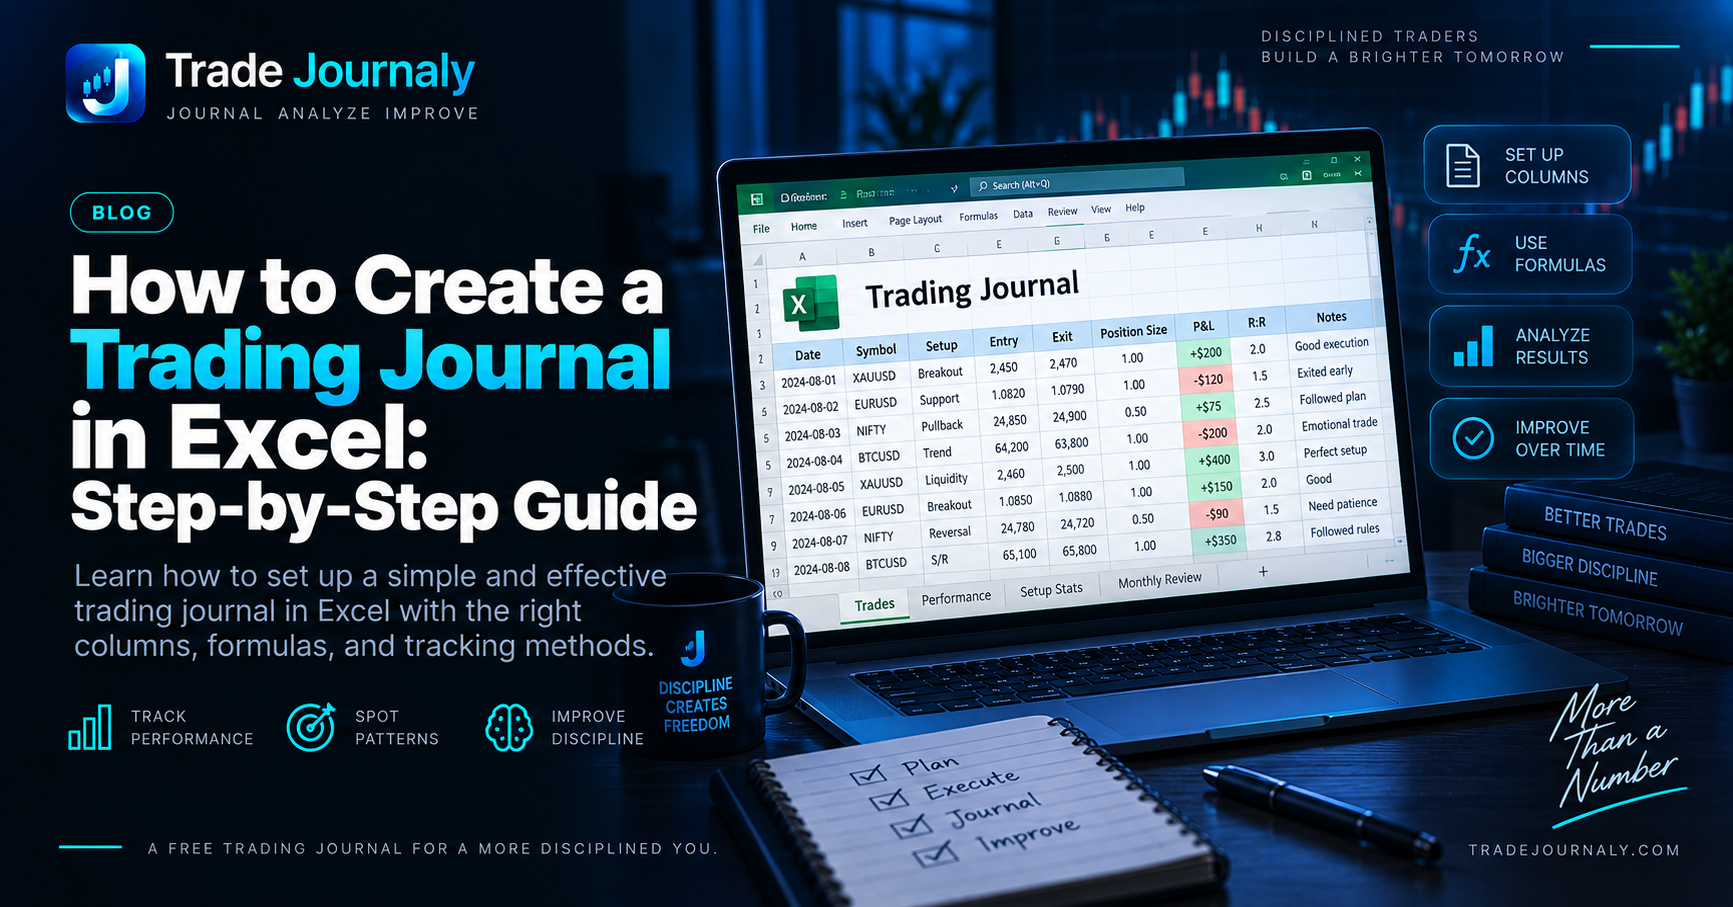
# Trading Journal Format: What Fields Should You Track? (2026)
A trading journal is only as valuable as the data you put into it. If your journal format tracks too few fields (such as only recording entry price and final profit), you will have no way of diagnosing why a trade succeeded or failed.
Conversely, if your journal format requires 40 burdensome questions for every single scalp, you will burn out and stop logging trades entirely.
An institutional-grade trading journal format strikes the perfect balance between analytical depth and daily sustainability.
In this guide, we break down the exact data architecture used by professional traders and explain the rationale behind each field.
The 4-Layer Trading Journal Format Architecture #
A complete trading journal format is structured across four functional layers:
┌─────────────────────────────────────────────────────────┐
│ 1. EXECUTION MECHANICS (What happened in the market)    │
├─────────────────────────────────────────────────────────┤
│ 2. RISK & METRIC TELEMETRY (How risk was managed)       │
├─────────────────────────────────────────────────────────┤
│ 3. STRATEGY & MARKET CONTEXT (Why the trade was taken)  │
├─────────────────────────────────────────────────────────┤
│ 4. BEHAVIOR & PROCESS AUDIT (How the human performed)   │
└─────────────────────────────────────────────────────────┘
Layer 1: Execution Mechanics (Factual Price Data) #
These fields represent the factual ledger of what occurred on your broker terminal:
- Trade ID & Timestamp: Exact entry date, entry time, exit date, and exit time. Logging timestamps allows you to filter performance by market session (e.g., London Open vs. New York Lunch).
- Instrument / Symbol: The traded asset (
NQ,BANKNIFTY,EURUSD,SOLUSDT,TSLA). - Trade Direction:
LONGorSHORT. - Filled Entry Price: The exact average executed price on entry.
- Filled Exit Price: The exact average executed price on closing.
- Position Size (Quantity / Lots / Contracts): Number of shares, contracts, or lots traded.
- Gross P&L vs. Net P&L: Always separate broker commissions and exchange fees from your gross profit to see the real impact of trading friction.
Layer 2: Risk & Metric Telemetry (Normalized Risk) #
Tracking raw dollar P&L is one of the most common mistakes amateur traders make. If you win $500 on a trade where you risked $2,000, that is a poor $+0.25\text{R}$ execution despite the green dollar sign.
| Data Field | Definition | Mathematical Significance |
|---|---|---|
| Initial Stop Loss | Planned invalidation price level | Defines your maximum allowed loss before trade entry. |
| Take Profit Target | Planned exit level based on structure | Establishes your ex-ante risk-to-reward ratio. |
| $1\text{R}$ Cash Risk | Dollar amount risked if stop is hit | Normalizes all trade sizes across different account balances. |
| Planned R:R | $\frac{\text{Target} - \text{Entry}}{\text{Entry} - \text{Stop}}$ | Determines whether the setup met your minimum payoff criteria. |
| Realized R-Multiple | $\frac{\text{Net P\&L}}{\$1\text{R}}$ | Measures execution efficiency: $+2.0\text{R}$ is a textbook win, $-1.0\text{R}$ is a disciplined loss. |
| Maximum Adverse Excursion (MAE) | Furthest distance price moved against you | Identifies whether your stop losses are placed too tight or too wide. |
| Maximum Favorable Excursion (MFE) | Peak unrealized profit during the trade | Reveals whether you leave substantial profit on the table by not trailing. |
Layer 3: Strategy & Market Context (Playbook Alignment) #
This layer categorizes why you entered the trade, allowing you to isolate which setups carry genuine statistical edge:
- Setup / Strategy Tag: The specific pattern from your playbook (e.g., Opening Range Breakout, Liquidity Sweep Reversal, Fair Value Gap Fill, Mean Reversion).
- Timeframe: Higher timeframe trend context (1D, 4H) vs. entry execution timeframe (15m, 5m, 1m).
- Market Regime: Trending Bullish, Trending Bearish, Choppy / Rangebound, High Volatility News Event.
- Pre-Trade Screenshot: Visual chart screenshot captured at the moment of entry showing your technical reasoning and marked levels.
- Post-Exit Screenshot: Visual chart screenshot showing what price did after your exit.
Layer 4: Behavioral & Psychological Audit #
Most trading losses stem from psychological failure rather than flawed technical indicators. Your format must track the human operating the system:
- Pre-Trade Mental State: Calm, Confident, Impatient, Anxious, Chasing FOMO.
- Execution Error Tags:
- Oversizing (risking $>1.5\text{R}$)
- Moved Stop Loss (widening risk when price went negative)
- Early Exit (closing before target due to fear)
- Revenge Trade (entering immediately after a loss to make back capital)
- Rule Adherence Score (1–5 or YES/NO): Did you follow 100% of your trading rules?
- Post-Trade Lesson / Takeaway: A 1-sentence reflection on what was executed well or what needs adjustment.
Summary: Essential Fields Checklist #
Use this quick checklist to audit your existing trading journal format:
- [ ] Exact Entry & Exit Timestamps
- [ ] Symbol, Direction, and Asset Class
- [ ] Entry Price, Stop Loss, and Exit Price
- [ ] Position Size and Total Fees
- [ ] $1\text{R}$ Initial Dollar Risk
- [ ] Realized R-Multiple
- [ ] Playbook Setup Tag
- [ ] Entry & Exit Chart Screenshots
- [ ] Emotional State Tag
- [ ] Rule Adherence Indicator
Turn your trading history into something you can learn from.
Eliminate emotional revenge trading and moving stop-losses with TradeJournaly's zero-credential AI screenshot extraction terminal.