
How to Create a Trading Journal in Excel: Step-by-Step Guide
Learn how to build a complete trading journal in Excel from scratch, including essential columns, automated formulas, win rate calculations, and R-multiple tracking.
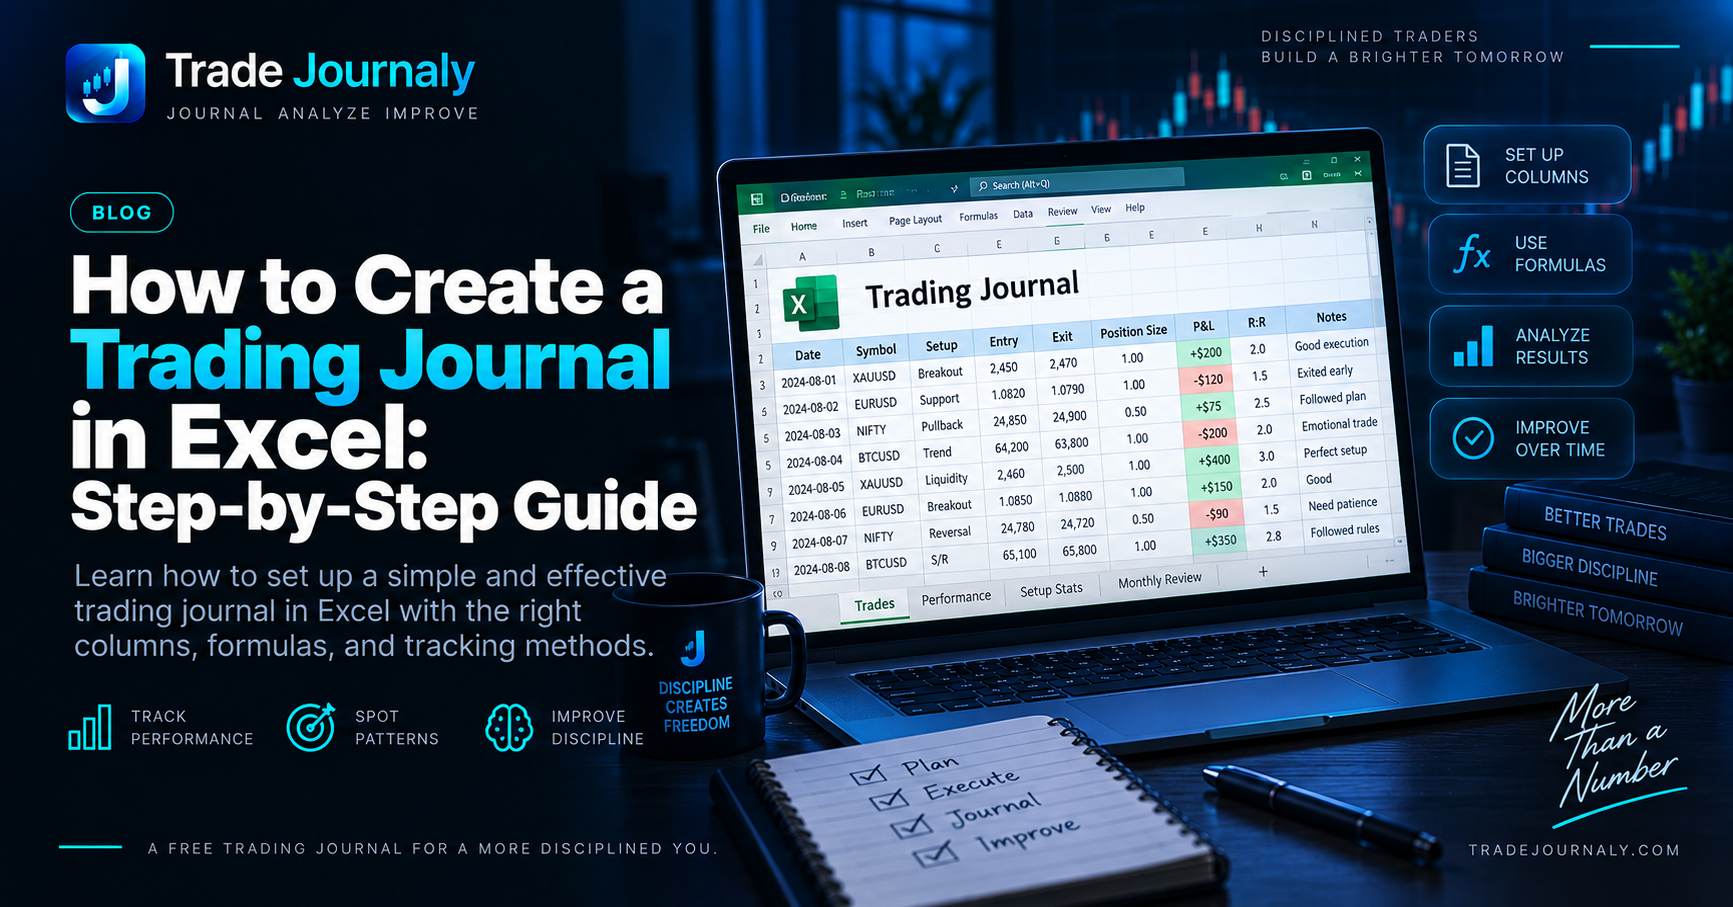
# How to Create a Trading Journal in Excel: Step-by-Step Guide
If you want to treat trading like a serious business rather than an expensive hobby, logging your trades is non-negotiable. For decades, Microsoft Excel and Google Sheets have been the default starting point for traders building their first trade log.
An Excel trading journal gives you complete control over your data structure, requires zero monthly subscriptions, and helps you understand the underlying mathematics of your trading system.
In this guide, we will walk step by step through building a robust, formula-driven Excel trading journal from scratch, explain what formulas you need, and discuss when a spreadsheet works best and where modern screenshot-first tools save time.
Direct Answer: What Makes an Effective Excel Trading Journal? #
An effective Excel trading journal must track three distinct layers of data:
- Execution Mechanics: Date, symbol, direction (Long/Short), entry price, exit price, position size, and commissions.
- Normalized Risk (R-Multiples): Initial stop loss, planned risk in dollars ($1\text{R}$), realized profit or loss, and realized R-multiple.
- Strategy & Context: Setup playbook tag, market session, emotional state, and rule adherence score.
Without tracking normalized risk ($1\text{R}$), an Excel sheet merely records dollar amounts without showing whether your wins came from disciplined execution or reckless over-leveraging.
Step 1: Set Up Your Core Column Headers #
Open a new blank workbook in Excel. In row 1 of Sheet 1 (rename this sheet to Trade_Log), enter the following column headers across columns A through P:
| Column | Header Name | Format Type | Purpose |
|---|---|---|---|
| A | Trade ID | Number / Text | Unique identifier (#001, #002) |
| B | Date & Time | Date (YYYY-MM-DD hh:mm) | Exact timestamp of entry |
| C | Symbol / Asset | Text | EURUSD, NIFTY, BTCUSDT, AAPL |
| D | Direction | Dropdown (LONG / SHORT) | Trade side |
| E | Setup / Strategy | Dropdown (Breakout, Pullback, Reversal) | Playbook category |
| F | Entry Price | Currency / Decimal | Execution fill price |
| G | Stop Loss | Currency / Decimal | Pre-planned exit level on loss |
| H | Take Profit | Currency / Decimal | Planned target exit level |
| I | Exit Price | Currency / Decimal | Actual closed price |
| J | Position Size | Number / Lots / Shares | Quantity traded |
| K | Initial Risk ($1\text{R}$) | Currency | Dollar risk at stop loss |
| L | Gross P&L | Currency | Raw realized profit or loss |
| M | Fees & Commissions | Currency | Brokerage, slippage, exchange fees |
| N | Net P&L | Currency | Gross P&L minus Fees |
| O | Realized R-Multiple | Decimal (0.00\text{R}) | Net P&L divided by Initial Risk |
| P | Rule Followed? | Dropdown (YES / NO) | Psychological discipline check |
Step 2: Add Essential Excel Formulas #
To make your spreadsheet calculate automatically, add these standard Excel formulas to Row 2:
1. Initial Risk ($1\text{R}$) in Column K #
For Long Trades:
=IF(D2="LONG", (F2-G2)*J2, (G2-F2)*J2)2. Gross P&L in Column L #
=IF(D2="LONG", (I2-F2)*J2, (F2-I2)*J2)3. Net P&L in Column N #
=L2-M24. Realized R-Multiple in Column O #
=IF(K2>0, N2/K2, 0)This formula divides your Net Profit by your Initial Risk. If you risked $100 and made $250, column O will display 2.50 ($+2.5\text{R}$). If you lost $100, it will show -1.00 ($-1.0\text{R}$).
Step 3: Build a Summary Dashboard Sheet #
Create a second worksheet named Summary_Dashboard. This tab will aggregate your performance across your entire sample size:
| Metric | Excel Formula |
|---|---|
| Total Trades | =COUNTA(Trade_Log!A2:A1000) |
| Winning Trades | =COUNTIF(Trade_Log!N2:N1000, ">0") |
| Losing Trades | =COUNTIF(Trade_Log!N2:N1000, "<0") |
| Win Rate (%) | =COUNTIF(Trade_Log!N2:N1000, ">0")/COUNTA(Trade_Log!A2:A1000) |
| Total Net P&L | =SUM(Trade_Log!N2:N1000) |
| Average Win ($) | =AVERAGEIF(Trade_Log!N2:N1000, ">0") |
| Average Loss ($) | =AVERAGEIF(Trade_Log!N2:N1000, "<0") |
| Profit Factor | =ABS(SUMIF(Trade_Log!N2:N1000, ">0") / SUMIF(Trade_Log!N2:N1000, "<0")) |
| Average R-Multiple | =AVERAGE(Trade_Log!O2:O1000) |
| Discipline Rate (%) | =COUNTIF(Trade_Log!P2:P1000, "YES")/COUNTA(Trade_Log!A2:A1000) |
Common Pitfalls With Excel Trading Journals #
While Excel is an excellent low-cost starting tool, many traders hit significant friction points after a few months:
- Manual Entry Fatigue: Entering 16 columns per trade manually after an exhausting session leads to procrastination.
- Missing Chart Screenshots: Excel cannot natively organize high-resolution before/after chart screenshots cleanly. When reviewing a trade 3 months later, you see numbers but cannot remember the market structure.
- Formula Corruption: Accidental cell edits or dragged formula errors can silently distort your historical win rate or profit factor.
- Lack of Behavioral Telemetry: Spreadsheets do not automatically alert you when you revenge trade, oversize after a loss, or move your stop loss during a drawdown.
When to Use Excel vs. Automated Screenshot Journaling #
| Feature | Excel / Google Sheets | TradeJournaly (AI Screenshot Journal) |
|---|---|---|
| Cost | Free / Low | Free Tier Available |
| Data Privacy | 100% Local | Private Cloud / No Broker Passwords |
| Setup Time | 2–3 Hours | Instant (Upload Screenshot) |
| Chart Context | Hyperlinks / Difficult | Native Visual Trade Cards |
| R-Multiple Auto-Math | Requires Custom Formula | Automatic $1\text{R}$ Normalization |
| Behavioral Leak Telemetry | None (Manual Audit) | Deterministic (Revenge & Oversizing Alerts) |
Frequently Asked Questions #
Can I build an Excel trading journal for Crypto and Forex? #
Yes. For Forex, make sure your position size formula accounts for lot sizes (1 Standard Lot = 100,000 units) and pip value calculations. For Crypto, ensure your price columns support up to 6 to 8 decimal places for low-denomination tokens.
How often should I update my Excel journal? #
Log the trade setup, entry price, and initial stop loss immediately when the order is filled. Enter the exit price, fees, and post-trade notes at the end of the trading session during your daily debrief.
What is the most important formula in an Excel trade log? #
The Realized R-Multiple formula (=Net_PnL / Initial_Risk). Dollar figures can be deceptive if you vary position sizes, but R-multiples measure your true execution quality independent of capital.
Turn your trading history into something you can learn from.
Eliminate emotional revenge trading and moving stop-losses with TradeJournaly's zero-credential AI screenshot extraction terminal.