
Trading Win Rate: What It Means and Why It Isn't Everything
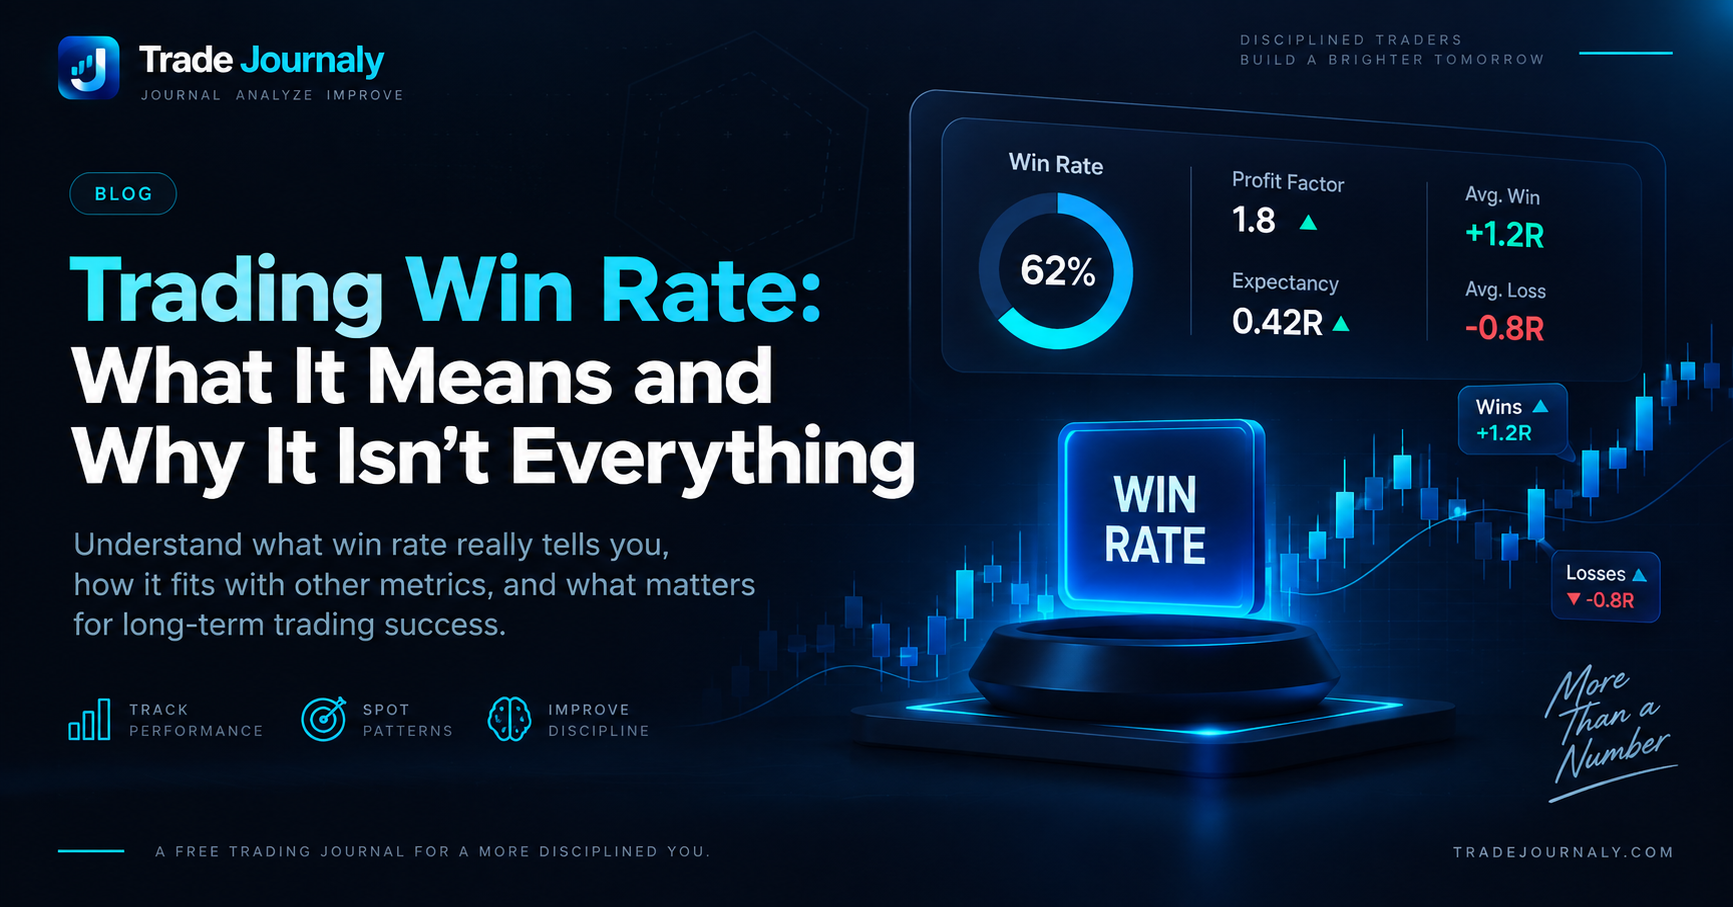
Understand why win rate alone does not determine trading profitability. Explore the mathematical relationship between win rate, payoff ratio, and expectancy.
# Trading Win Rate: What It Means and Why It Isn't Everything
In popular trading culture, win rate is often marketed as the ultimate badge of trading mastery. Social media is inundated with claims of "90% win rate secret indicators" and algorithmic trading bots that "never lose a trade."
This cultural obsession with being right on every trade taps into a deep human vulnerability: from our earliest years in school, we are conditioned to believe that getting 90% of answers right represents an "A" grade, while getting 40% right represents total failure.
In financial markets, however, applying academic grading standards will guarantee financial ruin. Some of the most successful hedge funds and trend-following legends in history operate with win rates between 35% and 45%, while thousands of retail traders blow up their accounts with win rates above 80%.
Quick Answer:
Trading Win Rate is the percentage of closed trades that result in a net profit after all commissions and fees:
$$\text{Win Rate (\%)} = \left( \frac{\text{Winning Trades}}{\text{Total Closed Trades}} \right) \times 100$$
Win rate is only one half of the profitability equation. A strategy's true financial performance is determined by the product of its win rate and its payoff ratio (Average Win ÷ Average Loss). A 40% win rate strategy with a 3:1 payoff ratio is vastly superior to an 85% win rate strategy with a 0.1:1 payoff ratio.
The Formula and Calculation of Win Rate #
Calculating your win rate is mathematically straightforward:
$$\text{Win Rate} = \left( \frac{W}{W + L + BE} \right) \times 100$$
Where:
- $W$ = Number of winning trades (Net Realized P&L > $0)
- $L$ = Number of losing trades (Net Realized P&L < $0)
- $BE$ = Breakeven trades (Net Realized P&L = $0, after deducting all transaction costs)
Critical Nuance: Deducting Friction Costs #
Many traders mistakenly categorize a trade that gained $5.00 gross as a "win," even if they paid $12.00 in broker commissions and exchange fees. A trade that finishes at -$7.00 net is a losing trade. Always calculate win rate using net realized outcomes.
For complete benchmarks on strike rates across asset classes, read our guide on Trading Win Rate.
The Mathematical Proof: Why High Win Rate Does Not Equal Profitability #
To understand why win rate cannot be evaluated in isolation, consider the comparison between two distinct trading profiles over a 100-trade sample (assuming a $100 initial risk per trade):
Trader A ("The High-Win Rate Scalper"):
- Win Rate: 85% (85 Winning Trades, 15 Losing Trades)
- Average Win: $25 (Quickly exits to protect strike rate)
- Average Loss: $200 (Refuses to take small stops, lets losers run)
- Total Gross Profit: 85 × $25 = +$2,125
- Total Gross Loss:   15 × $200 = -$3,000
- Net Realized P&L:   -$875.00 (NEGATIVE)

Trader B ("The Systematic Trend Follower"):
- Win Rate: 40% (40 Winning Trades, 60 Losing Trades)
- Average Win: $350 (Rides trends to 3.5R targets)
- Average Loss: $100 (Cuts losses strictly at 1.0R)
- Total Gross Profit: 40 × $350 = +$14,000
- Total Gross Loss:   60 × $100 = -$6,000
- Net Realized P&L:   +$8,000.00 (POSITIVE)
Look closely at the numbers: Trader B lost 60% of their trades and made +$8,000 in net profit, while Trader A won 85% of their trades and lost -$875.
This dynamic explains why chasing high win rates without strict risk-reward controls is one of the most dangerous traps in trading.
The Payoff Matrix: Required Win Rate for Breakeven #
The table below illustrates the exact mathematical win rate required to break even across different Reward-to-Risk (R:R) ratios:
| Reward-to-Risk Ratio | Required Breakeven Win Rate | Example Average Win | Example Average Loss | Net Expectancy at 50% Win Rate |
|---|---|---|---|---|
| 0.5 : 1 (Risk $2 to make $1) | 66.7% | $100 | $200 | -0.50R (Losing System) |
| 1.0 : 1 (Risk $1 to make $1) | 50.0% | $100 | $100 | 0.00R (Breakeven) |
| 1.5 : 1 (Risk $1 to make $1.50) | 40.0% | $150 | $100 | +0.25R (Solid Edge) |
| 2.0 : 1 (Risk $1 to make $2) | 33.3% | $200 | $100 | +0.50R (Strong Edge) |
| 3.0 : 1 (Risk $1 to make $3) | 25.0% | $300 | $100 | +1.00R (Exceptional Edge) |
| 5.0 : 1 (Risk $1 to make $5) | 16.7% | $500 | $100 | +2.00R (Trend Following) |
$$\text{Breakeven Win Rate (\%)} = \frac{1}{1 + \text{Reward-to-Risk Ratio}} \times 100$$
Notice that if your strategy produces an average reward-to-risk ratio of 2:1, you only need to win 34 out of 100 trades to be profitable. Every win above that threshold is pure alpha.
To dive deeper into the mathematics of payoff asymmetry, see our guide on Risk-Reward Ratio in Trading.
Strategy Archetypes: How Win Rates Vary by Style #
Different trading methodologies naturally produce vastly different win-rate profiles. Understanding your style prevents unrealistic expectations:
1. Trend Following & Momentum Breakout #
- Typical Win Rate: 30% – 45%
- Typical Payoff Ratio: 3:1 to 6:1
- Characteristics: Suffers frequent small 1R losses during range-bound conditions, but captures massive multi-R runners when major trends emerge.
2. Swing Trading & Key Level Reversals #
- Typical Win Rate: 45% – 55%
- Typical Payoff Ratio: 1.5:1 to 2.5:1
- Characteristics: Balanced distribution; aims for structured technical swings between support and resistance.
3. Mean Reversion & Short-Term Scalping #
- Typical Win Rate: 60% – 75%
- Typical Payoff Ratio: 0.75:1 to 1.25:1
- Characteristics: High frequency of small gains; highly vulnerable to sudden volatility spikes and large runaway losses if stops are not strictly enforced.
The Real Metrics to Pair With Win Rate #
To gain an accurate, comprehensive evaluation of your trading system, win rate must always be evaluated alongside three companion metrics:
- Profit Factor: Total gross profits divided by total gross losses (target 1.30 to 2.00+).
- Trading Expectancy: The average R-multiple return expected per trade across a 100-trade sample.
- Maximum Drawdown: The deepest peak-to-trough equity decline experienced during losing streaks.
How TradeJournaly Delivers True Strike-Rate Clarity #
Rather than providing a single vanity win rate, TradeJournaly contextualizes your strike rate within your broader statistical profile:
- Interactive Win/Loss Radar: Visualizes your win rate alongside average win, average loss, and largest single outlier trades.
- Setup-Specific Strike Rates: Dissects your win rate by strategy playbook, revealing which setups possess real edge and which ones are dragging down your equity.
- Expectancy Curves: Automatically computes your net expectancy in R-multiples, proving whether your strategy has mathematical positive edge.
Key Takeaways #
- Win rate is only half the equation: Profitability is the product of how often you win and how much you win when right.
- Abandon the academic grading mindset: A 40% win rate is not a failure; when paired with asymmetric reward-to-risk, it creates consistent wealth.
- Watch out for high win-rate traps: Be wary of systems with 80%+ win rates that achieve high accuracy by taking massive hidden tail risks.
- Calculate breakeven thresholds: At a 2:1 reward-to-risk ratio, you only need a 33.4% win rate to be in profit.
- Audit your data over large samples: Track your realized win rate and profit factor across a minimum of 50 to 100 disciplined trades.